Overview of reports, database and functions
Your dashboard is structured into three different reports, two customer data views and several additional functions, more precisely:
- Main report: [Top left / Reports -> Dashboard] On the very left you will see the cumulated number of active email recipients. These are customers who confirmed their email address through a double Opt-in process and who are receiving retargeting emails. In the center you will see the number of results, i.e. registered customers. You can adapt the view to a daily, weekly or monthly basis and filter according to a certain period of time. On the right, you will see the latest appointment requests.
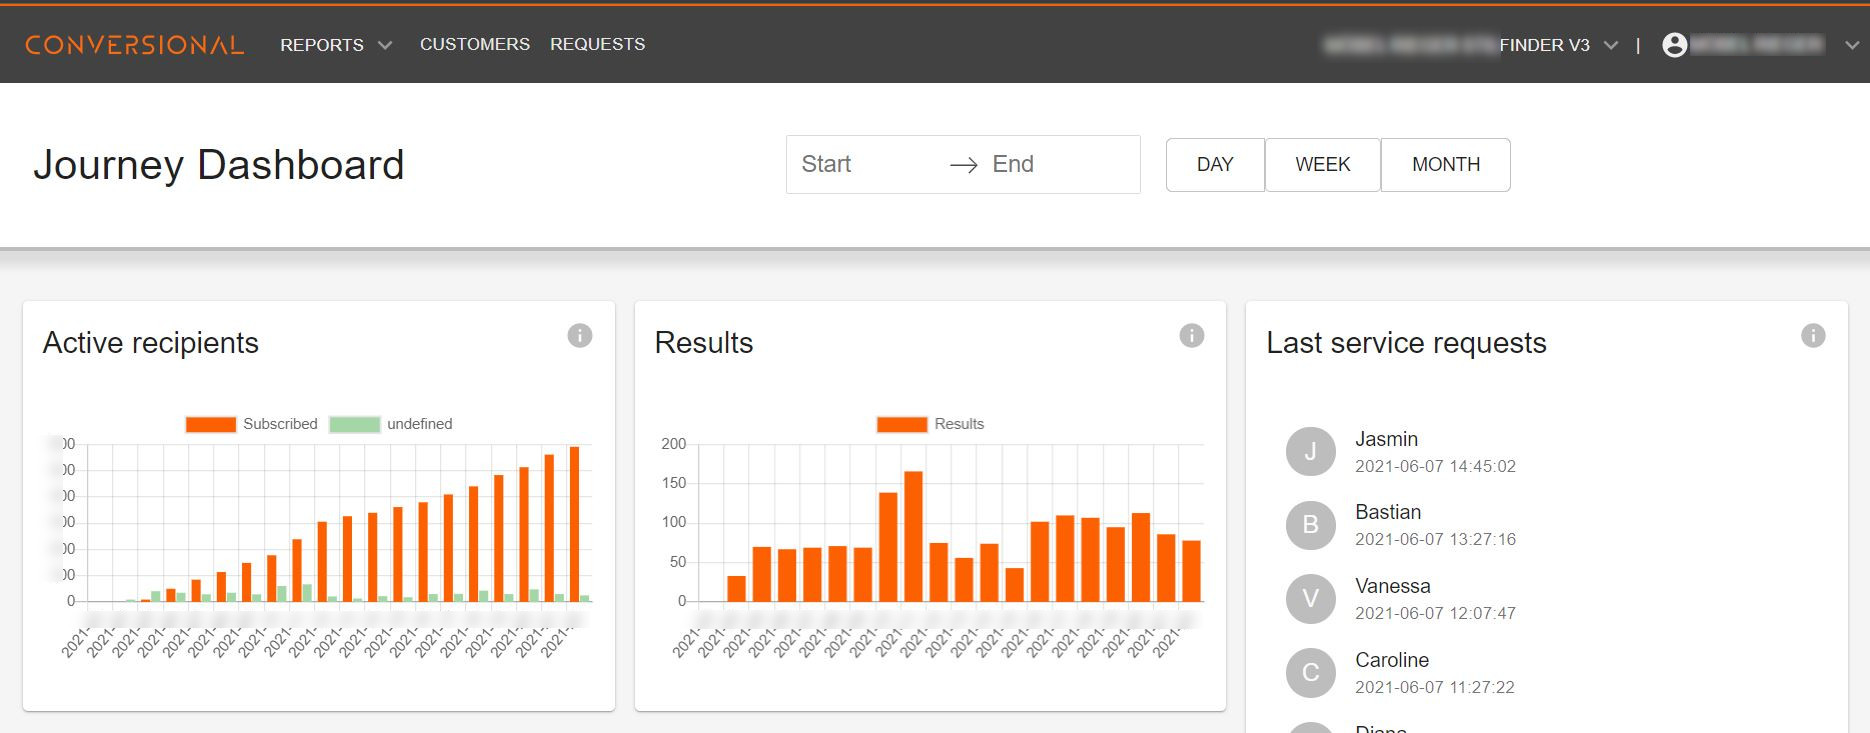 Main report including active email recipients, results per
period and the latest service requests.
Main report including active email recipients, results per
period and the latest service requests.
- Marketing report:[Top left / Reports -> Marketing] This report will show you an aggregated view of your customers' configuration requests. The data is based on the questionnaire and the result's interactive elements.
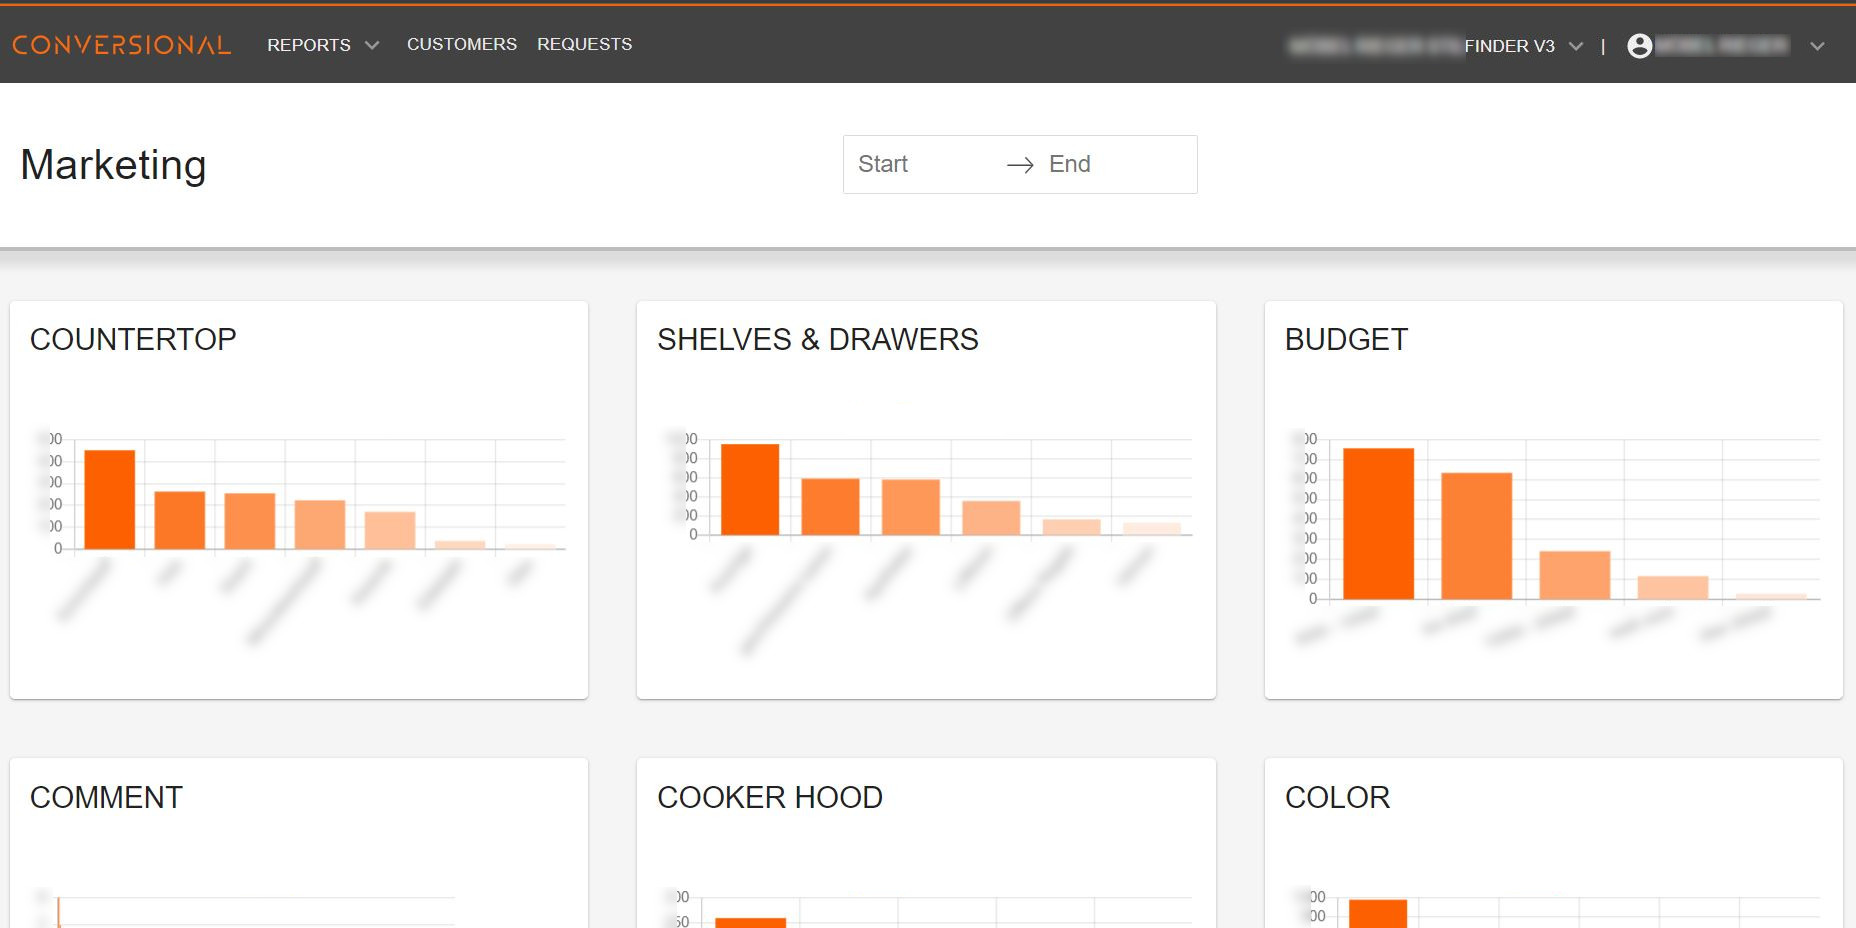 Marketing report showing your customers' configuration
requests.
Marketing report showing your customers' configuration
requests.
- Performance funnel: [Top left / Reports -> Performance] This report will show you the number of customers who started the tool, answered the first question, answered the last question, completed the form, book an appointment and confirmed their email address.
- Customer data view: [Top left / Customers] This database shows all the customers who at least finished the questionnaire, filled in their name and email address and received their personal recommandations.
- Appointment request view: [Top left / Requests] This database shows all the customers who at least finished the questionnaire, filled in their name and email address and received their personal recommandations.
- Tool switching function: [Top right / "Your tool name"] In case you are using several tools or you had a tool update, you can switch between the tools to have an adjusted data view.
- Billing, support and logout: [Top right / "Your company name"] This section allows you to check your bills, access the support contact information and log out.
Converting your leads
Wether you are using the dashboard in addition to your own CRM system or as your central database, you have different options to take advantage of the data.
- Monitoring your appointments: In your appointment request view, you will be able to check all your appointment request at one glance and see where and when appointments are requested most. By using the search function you can look up specific requests.
- Browsing customer data: In your customer view, you have all customer data you need. By clicking on the gear symbol you and your salesperson can directly access to the customer's personal result and his profile. Every preference is stored within his profile, wether it comes out of the questionnaire or it is a choice he made within his result.
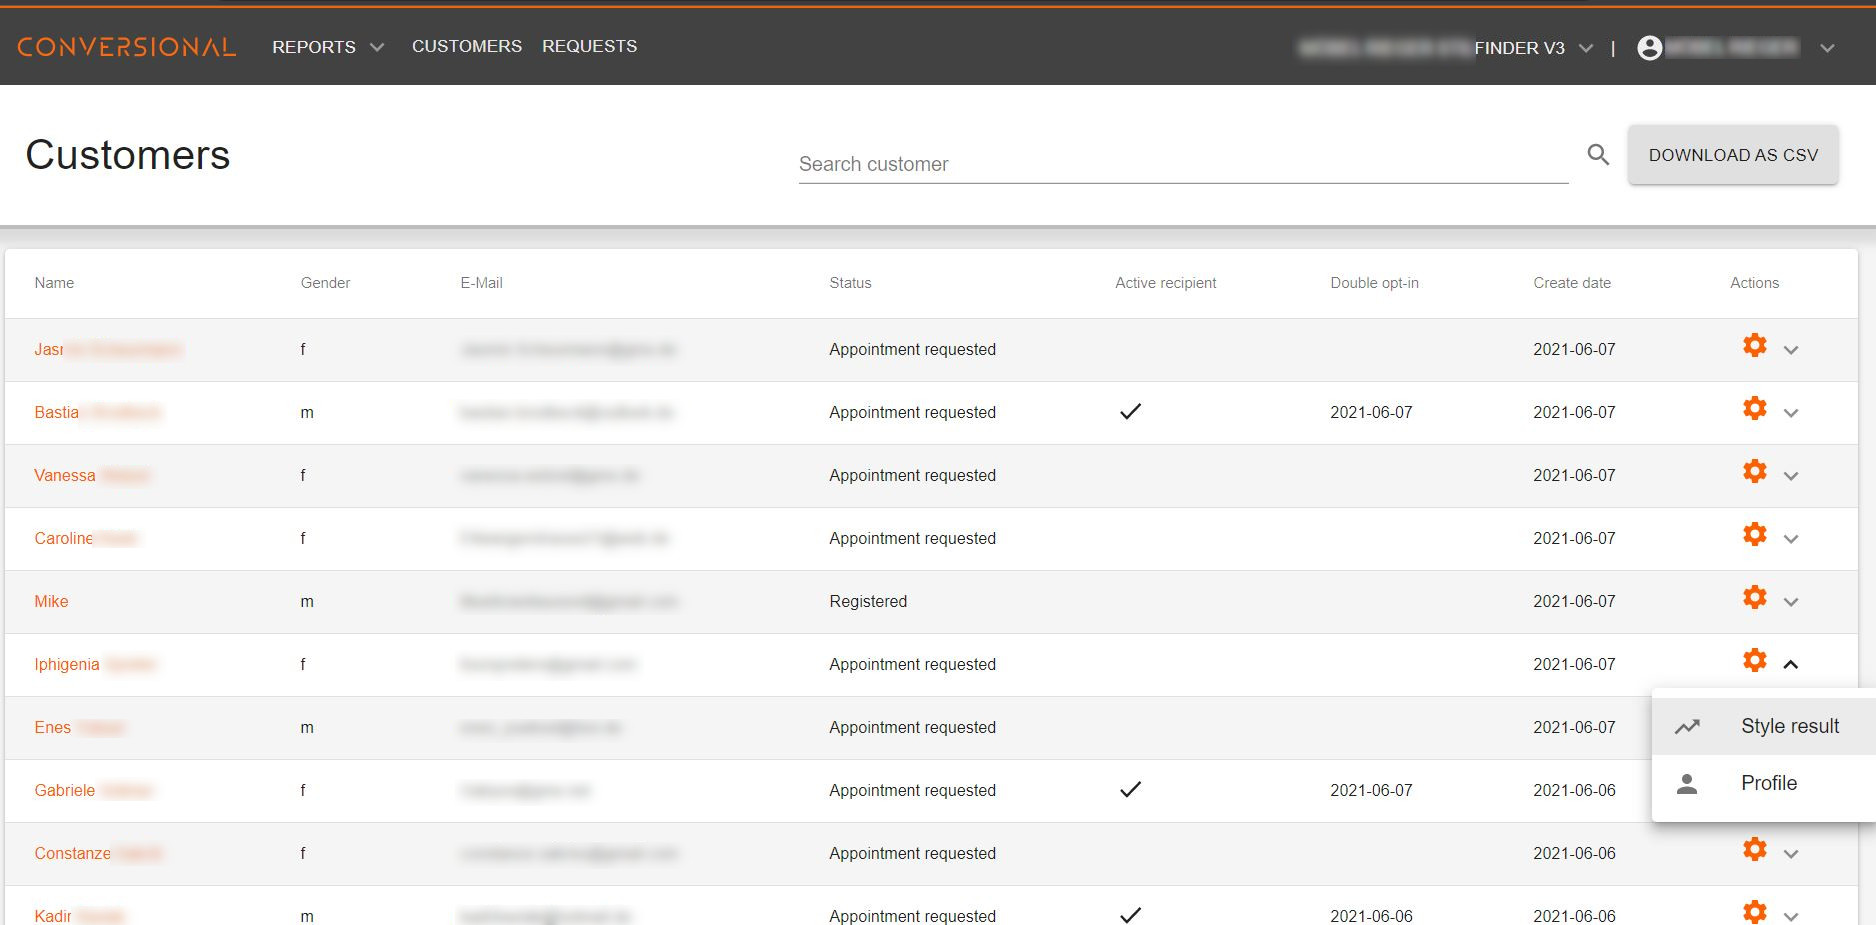 Customer view with profile data